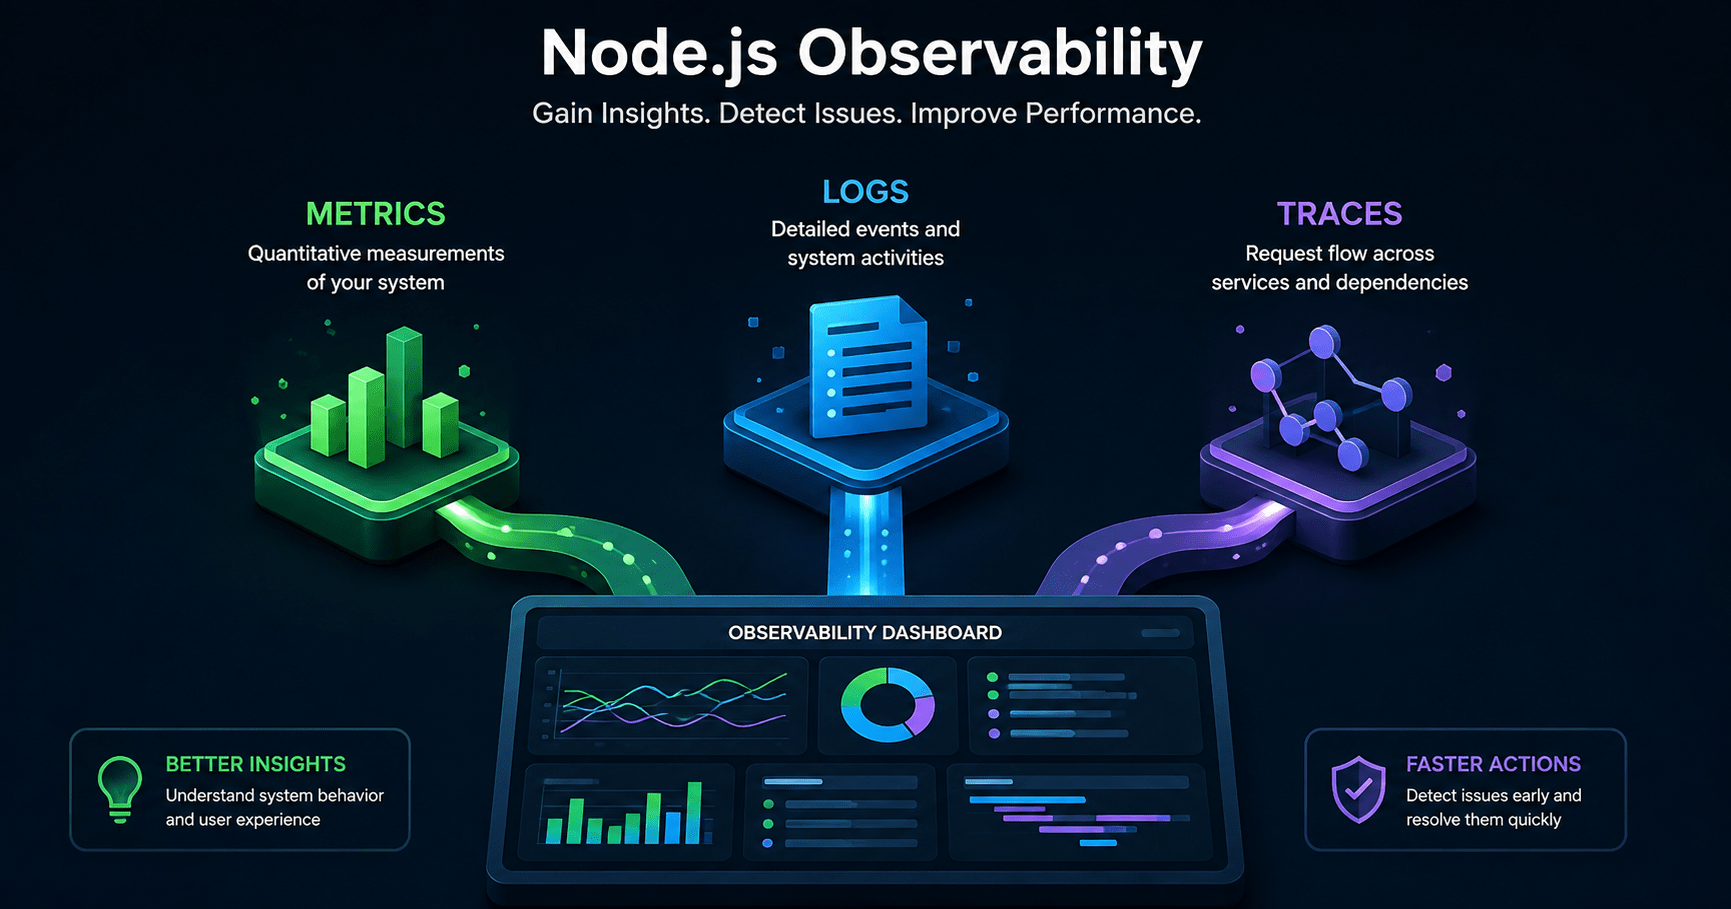

Node.js observability is what separates a full-stack app that survives production from one that quietly falls over at 2 AM with nobody watching. Building full-stack applications with modern frameworks like Next.js and NestJS delivers strong performance, but keeping that system reliable once real users show up requires deep operational visibility. When an asynchronous database query fails or an edge function times out, digging through unorganized console.log statements in your server logs is not going to cut it.
True production readiness means you can infer the internal state of your system just by looking at its external outputs. That is the whole idea behind Node.js observability. In this post, we will cover the three pillars of observability (metrics, logs, and traces), wire up real-time exception tracking and performance tracing with Sentry, set up vendor-neutral distributed tracing using OpenTelemetry (OTel) across microservices, and configure high-performance structured logging with Pino.
Also Read: Setting Up a ReactJs and Nextjs Project
What Node.js Observability Actually Means
Observability is not just “more logging.” It is the ability to ask new questions about your running system without shipping new code to answer them. For a stack that spans a Next.js frontend, a NestJS backend, and a database, that means you need visibility that follows a single request across every hop.
Node.js observability rests on three distinct telemetry signals, and each one answers a different question.
The Three Pillars of Node.js Observability
Metrics are aggregated numeric measurements over time windows, things like API response times, memory consumption, and error rates. They are essential for dashboards and alerting rules, and they answer “is something wrong right now?”
Logs are discrete, timestamped text or JSON records emitted during execution, like errors and auth events. They answer “what exactly happened at this moment?” and are essential for auditing a specific sequence of events.
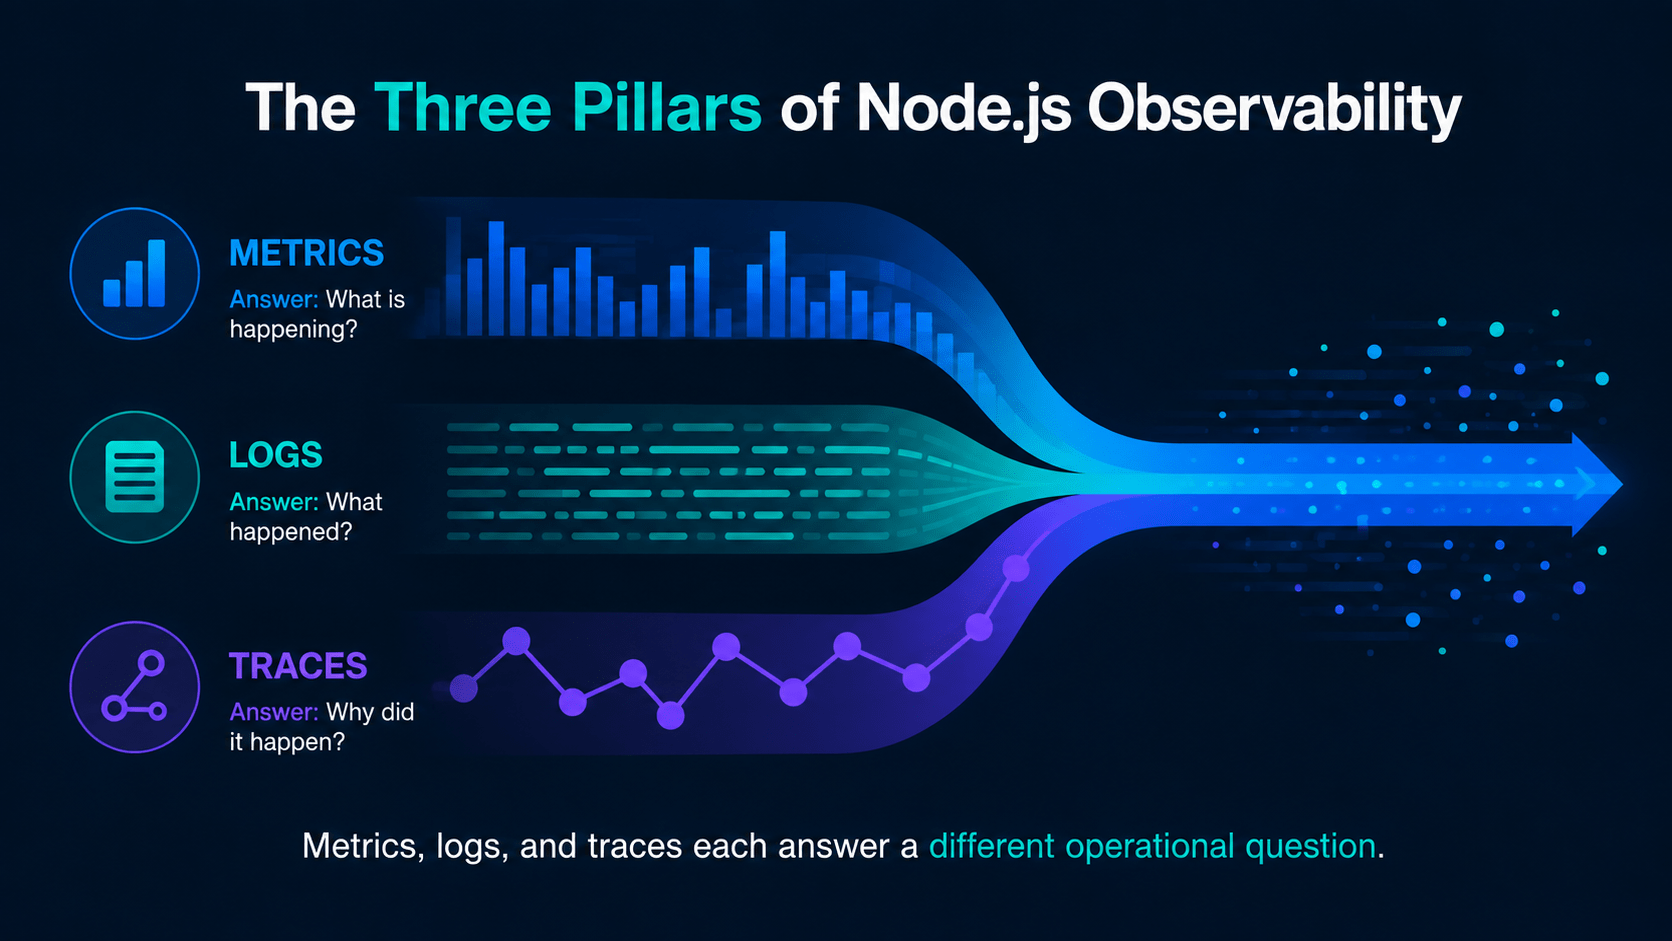
Traces are end-to-end paths of requests moving through distributed nodes. Spans within a trace record latency and metadata for each hop across service boundaries, for example a client request moving from Next.js into a NestJS API and down into PostgreSQL. Traces answer “where did the time actually go?”
Put together, these three signals give you a complete picture. Metrics tell you something broke, logs tell you what happened, and traces tell you where. That combination is the practical definition this guide works from.
Exception and Performance Monitoring with Sentry in Next.js
Sentry handles real-time error reporting, stack-trace source mapping, user impact scoring, and performance monitoring for both browser clients and backend runtimes. It is usually the fastest win in a Node.js observability setup because it needs almost no configuration to start catching real production errors.
Installing and Configuring the Sentry SDK
Install the Sentry Next.js SDK:
bash
npm install @sentry/nextjs
Initialize Sentry across the client, server, and edge runtimes using sentry.client.config.ts, sentry.server.config.ts, and sentry.edge.config.ts:
typescript
// sentry.client.config.ts
import * as Sentry from '@sentry/nextjs';

Sentry.init({
  dsn: process.env.NEXT_PUBLIC_SENTRY_DSN,
  tracesSampleRate: 1.0, // Adjust sampling rate in production (e.g., 0.1 for 10%)
  replaysSessionSampleRate: 0.1, // Session Replay for bug reproduction
  replaysOnErrorSampleRate: 1.0,
  integrations: [
    Sentry.replayIntegration({
      maskAllText: true,
      blockAllMedia: true,
    }),
  ],
  environment: process.env.NODE_ENV,
});

// sentry.server.config.ts
import * as Sentry from '@sentry/nextjs';

Sentry.init({
  dsn: process.env.SENTRY_DSN || process.env.NEXT_PUBLIC_SENTRY_DSN,
  tracesSampleRate: 0.2,
  environment: process.env.NODE_ENV,
});
To automatically map minified production bundle errors back to your TypeScript source, add Sentry to next.config.mjs:
javascript
// next.config.mjs
import { withSentryConfig } from '@sentry/nextjs';

const nextConfig = {
  reactStrictMode: true,
};

export default withSentryConfig(nextConfig, {
  org: 'devpulse-org',
  project: 'devpulse-nextjs',
  silent: true, // Suppress build output verbosity
  widenClientFileUpload: true,
  hideSourceMaps: true, // Hide source maps from public web distribution
});
Capturing Custom Exceptions and Breadcrumbs
Uncaught exceptions are only half the picture. Capture business logic exceptions manually, with context, so you are not stuck guessing later:
typescript
// app/api/checkout/route.ts
import { NextResponse } from 'next/server';
import * as Sentry from '@sentry/nextjs';

export async function POST(req: Request) {
  try {
    const body = await req.json();

    // Add contextual breadcrumb before processing
    Sentry.addBreadcrumb({
      category: 'checkout',
      message: `Processing checkout for user ${body.userId}`,
      level: 'info',
    });

    if (!body.paymentToken) {
      throw new Error('Payment token missing');
    }

    return NextResponse.json({ success: true });
  } catch (error) {
    // Attach user and domain context to exception trace
    Sentry.withScope((scope) => {
      scope.setTag('transaction_type', 'checkout');
      scope.setExtra('request_payload', error);
      Sentry.captureException(error);
    });

    return NextResponse.json({ error: 'Checkout processing failed' }, { status: 400 });
  }
}
That breadcrumb is what turns a generic “Payment token missing” alert into an error you can actually trace back to a specific user and checkout flow.
Distributed Tracing with OpenTelemetry Across Microservices
Sentry handles exception management well, but OpenTelemetry is the piece that makes cross-service visibility work at all. It is an open-source, vendor-neutral standard from the Cloud Native Computing Foundation (CNCF) for collecting distributed telemetry data.
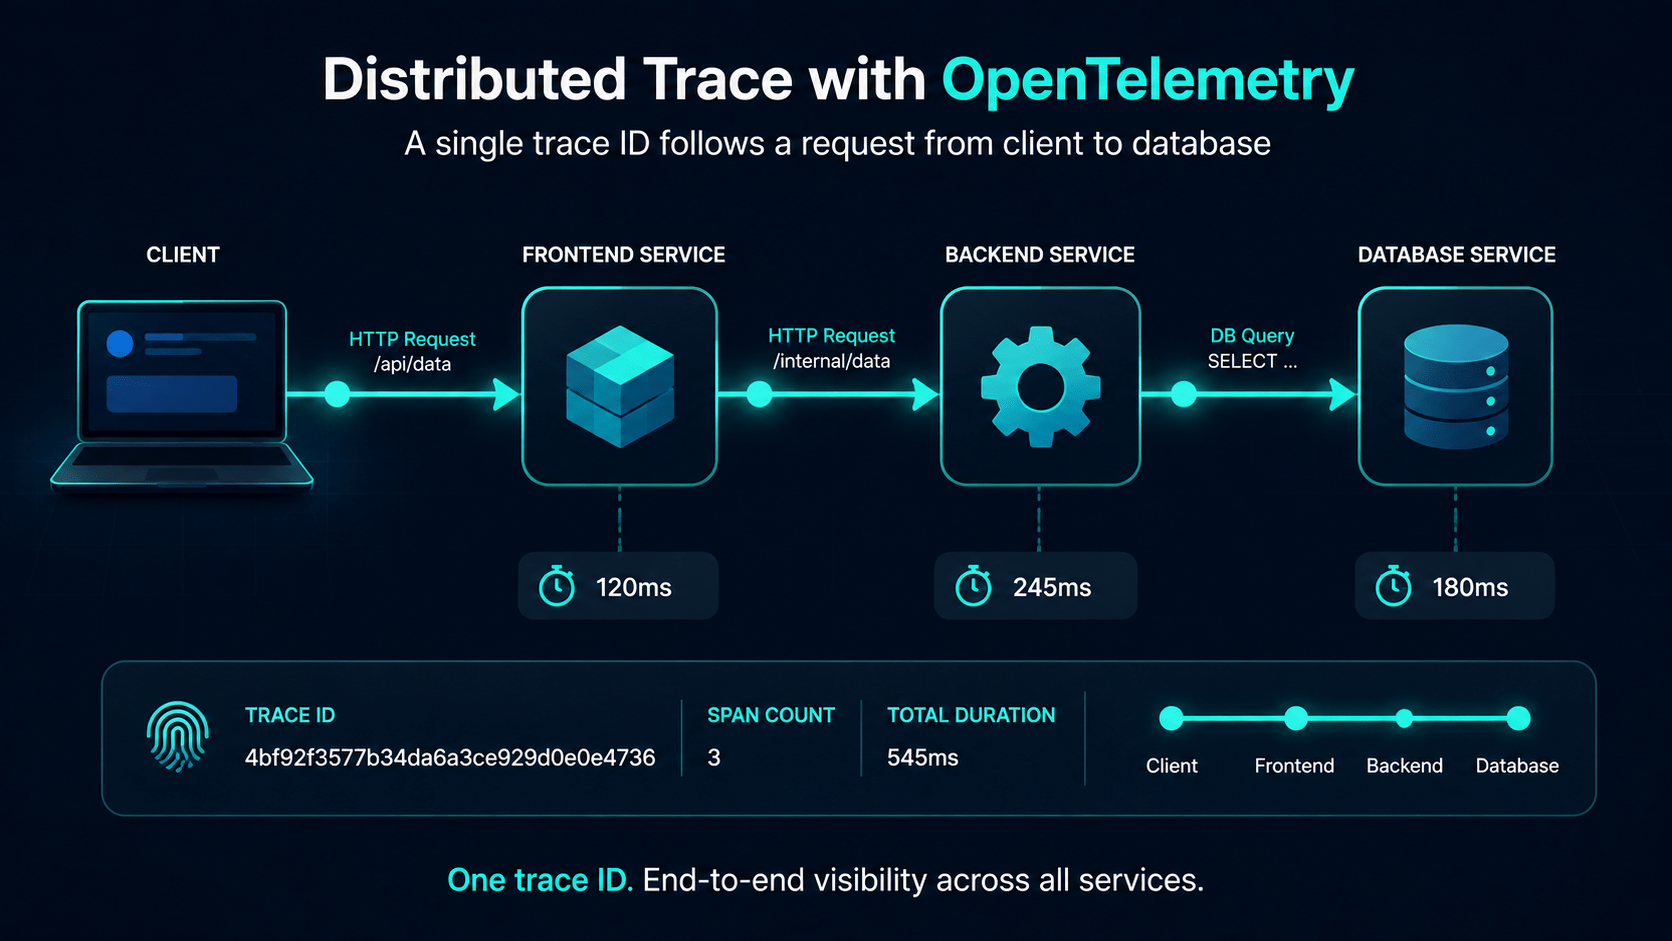
When a client sends an HTTP request to Next.js, which in turn calls a NestJS backend microservice, OpenTelemetry injects trace context through the traceparent HTTP header so every downstream operation shares a single trace ID. That is what lets you click one request in your dashboard and see it travel from the browser, through your BFF, into your API, and down to the database.
Setting Up OpenTelemetry in NestJS
Install the OpenTelemetry SDK and auto-instrumentation modules:
bash
npm install @opentelemetry/sdk-node @opentelemetry/auto-instrumentations-node @opentelemetry/exporter-trace-otlp-proto
Create an instrumentation setup script at src/tracer.ts:
typescript
// src/tracer.ts
import { NodeSDK } from '@opentelemetry/sdk-node';
import { getNodeAutoInstrumentations } from '@opentelemetry/auto-instrumentations-node';
import { OTLPTraceExporter } from '@opentelemetry/exporter-trace-otlp-proto';
import { Resource } from '@opentelemetry/resources';
import { ATTR_SERVICE_NAME } from '@opentelemetry/semantic-conventions';

const traceExporter = new OTLPTraceExporter({
  url: process.env.OTEL_EXPORTER_OTLP_ENDPOINT || 'http://localhost:4318/v1/traces',
});

export const otelSDK = new NodeSDK({
  resource: new Resource({
    [ATTR_SERVICE_NAME]: 'nestjs-backend-service',
  }),
  traceExporter,
  instrumentations: [
    getNodeAutoInstrumentations({
      // Auto-instrument HTTP, Express, Prisma, Redis, etc.
      '@opentelemetry/instrumentation-fs': { enabled: false },
    }),
  ],
});

// Graceful shutdown on process termination
process.on('SIGTERM', () => {
  otelSDK
    .shutdown()
    .then(() => console.log('OTel SDK shut down successfully'))
    .catch((err) => console.error('Error shutting down OTel SDK', err))
    .finally(() => process.exit(0));
});
Import and start the tracer before any other module loads inside src/main.ts:
typescript
// src/main.ts
import { otelSDK } from './tracer';

// Start OpenTelemetry SDK before bootstrapping NestJS
otelSDK.start();

import { NestFactory } from '@nestjs/core';
import { AppModule } from './app.module';

async function bootstrap() {
  const app = await NestFactory.create(AppModule);
  await app.listen(4000);
  console.log(`Backend service listening on port 4000`);
}
bootstrap();
That import order matters. OTel needs to patch Node’s internals before NestJS boots, or you will miss spans on your earliest requests.
High-Performance Structured Logging with Pino
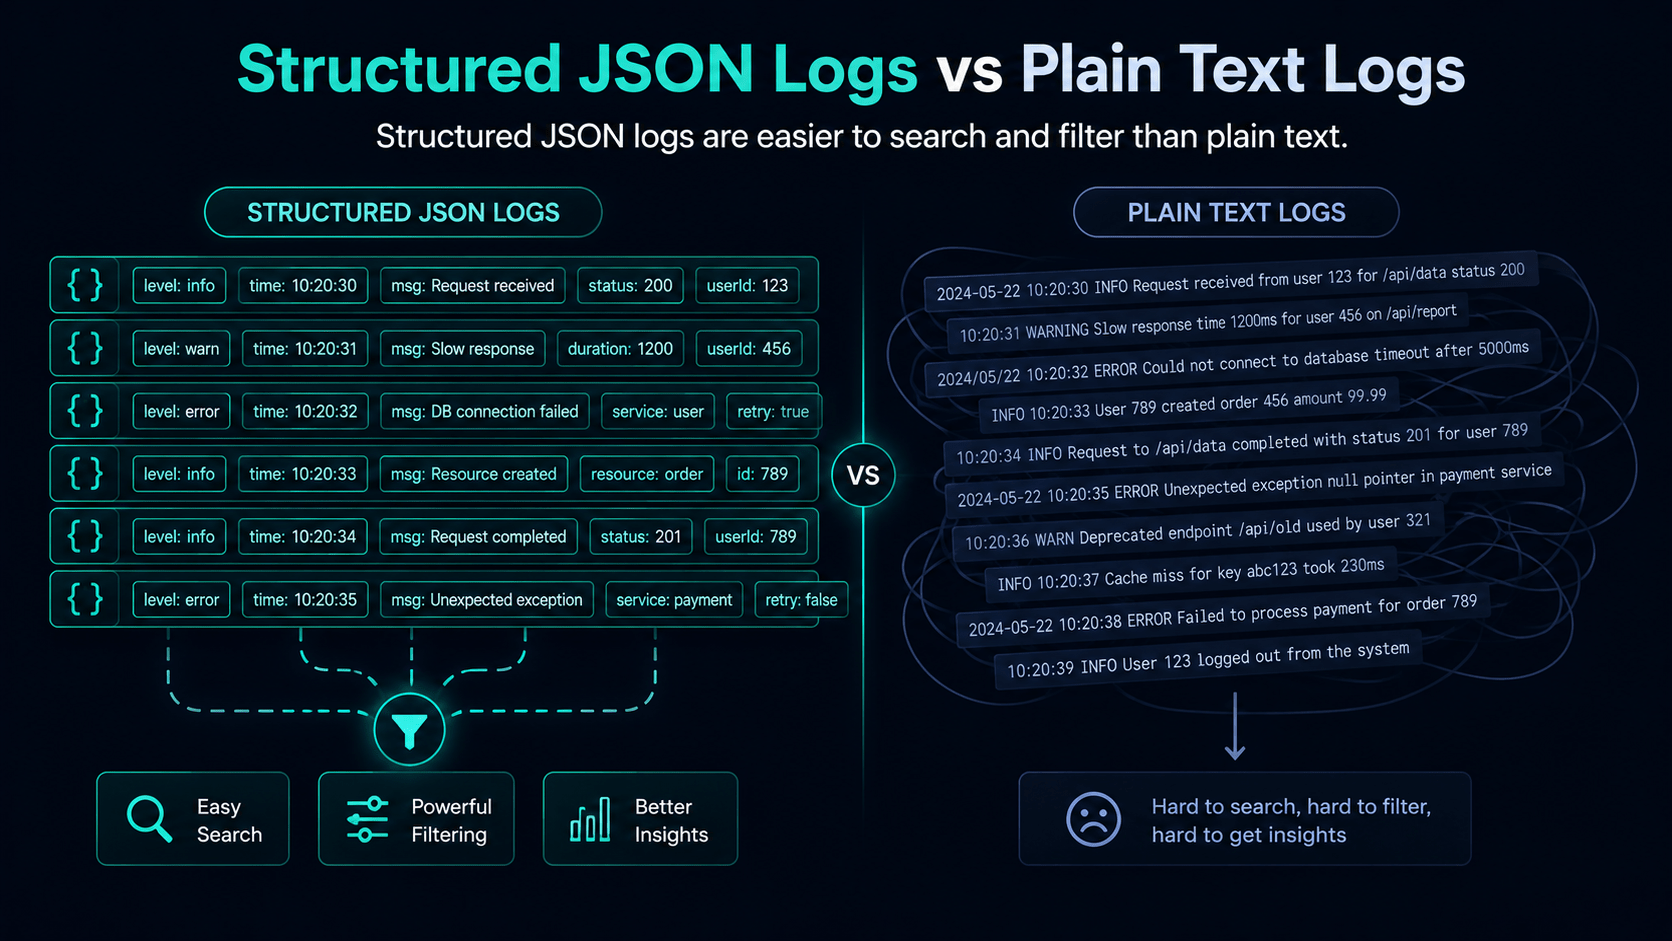
Standard console.log emits unstructured text strings, and log aggregation tools like Grafana Loki, Datadog, or AWS CloudWatch struggle to parse and filter that reliably. Pino is an extremely fast, asynchronous, structured JSON logger built for Node.js, and it is the logging layer most Node.js observability setups end up standardizing on.
Registering the Pino Logger in NestJS
Install nestjs-pino and pino-http:
bash
npm install nestjs-pino pino-http pino-pretty
Register LoggerModule inside AppModule:
typescript
// src/app.module.ts
import { Module } from '@nestjs/common';
import { LoggerModule } from 'nestjs-pino';

@Module({
  imports: [
    LoggerModule.forRoot({
      pinoHttp: {
        transport:
          process.env.NODE_ENV !== 'production'
            ? { target: 'pino-pretty', options: { colorize: true } }
            : undefined, // Emits raw JSON strings in production
        level: process.env.LOG_LEVEL || 'info',
        // Redact sensitive headers/credentials from logs
        redact: ['req.headers.authorization', 'req.headers.cookie', 'body.password'],
        customProps: (req) => ({
          traceId: req.headers['x-trace-id'] || 'N/A',
        }),
      },
    }),
  ],
})
export class AppModule {}
Then use the logger inside your services:
typescript
// src/users/users.service.ts
import { Injectable } from '@nestjs/common';
import { PinoLogger, InjectPinoLogger } from 'nestjs-pino';

@Injectable()
export class UsersService {
  constructor(
    @InjectPinoLogger(UsersService.name)
    private readonly logger: PinoLogger,
  ) {}

  async findUserById(userId: string) {
    this.logger.info({ userId }, 'Fetching user details from database');

    // JSON log output format in production:
    // {"level":30,"time":1700000000000,"pid":123,"hostname":"server-1","context":"UsersService","userId":"usr_123","msg":"Fetching user details from database"}

    return { id: userId, name: 'Alex' };
  }
}
Notice the redact array in the config above. Never skip that step. Structured logs are easy to search, which also makes it easy to accidentally ship an access token or a password straight into your log aggregator if you are not deliberate about what gets recorded.
Node.js Observability Checklist: Putting It All Together
Before you consider your setup production-ready, run through this quick checklist:
- Metrics are being collected and feeding a dashboard you actually look at.
- Sentry is initialized across client, server, and edge runtimes, with
tracesSampleRatetuned down for production traffic. - Breadcrumbs are attached to any exception that involves user or business context, not just the raw error object.
- OpenTelemetry is instrumented on every service in the request path, with the tracer started before the app boots.
- Pino is configured with
redactrules covering auth headers, cookies, and any field that could hold a password or token. - Trace IDs propagate from the frontend request all the way to the database query, so you can follow one request end to end.
Also Read: This post builds directly on the NestJS module patterns from earlier in the series and the deployment steps from our concluding Next.js guide. (Internal link slugs inferred — confirm against the live site before publishing, and consider back-linking from those earlier posts to this one once it’s live.)
FAQ
Do I need Sentry, OpenTelemetry, and Pino all at once?
Not on day one. Start with Sentry for exception tracking since it is the fastest to set up and gives you an immediate safety net. Add Pino once you need structured, searchable logs, then layer in OpenTelemetry when you are running more than one service and need to follow a request across boundaries.
Does OpenTelemetry replace Sentry?
No. They solve different problems. OpenTelemetry standardizes how trace data is collected and exported so you are not locked into one vendor. Sentry is a destination that consumes error data and, in many setups, trace data too. Many teams run both side by side.
Will adding tracing slow down my app?
A properly sampled setup adds minimal overhead. That is exactly why tracesSampleRate exists. Running at 1.0 in development is fine; production traffic should typically sample at 0.1 to 0.2, or lower for high-volume endpoints.
What’s the single most common Node.js observability mistake?
Redacting nothing. Teams wire up structured logging, get excited about how easy it is to search, and forget that “easy to search” also means “easy to accidentally leak a password or token.” Set your redact rules before you ship, not after an incident.
Where do I send OpenTelemetry data?
Anywhere that speaks the OTLP protocol: Grafana Tempo, Honeycomb, Datadog, or Sentry’s own tracing product, among others. The OTEL_EXPORTER_OTLP_ENDPOINT environment variable is where you point it.
Conclusion
Node.js observability is not one tool, it’s three signals working together. Metrics tell you something is wrong, logs tell you what happened, and traces tell you where the time went. Wire up Sentry first for the fastest safety net, add Pino for logs you can actually search, and bring in OpenTelemetry once your request path spans more than one service.
With this phase of the NestJS backend series wrapped up, we’re heading into Python and AI/ML infrastructure for JavaScript engineers next. In Blog Post 38, we’ll map Node.js and TypeScript patterns to modern Python tooling: uv, Pydantic, asyncio, and type hinting.