
We’ve spent the last six phases of our React and Next.js series building interactive, good-looking React apps, but your Core Web Vitals decide whether anyone sticks around to use them. Here’s the hard truth: if your app is slow, nothing else matters.
Users bounce and conversions drop. Google also uses page experience signals when it ranks pages, so a slow app can cost you traffic too.
Google introduced Core Web Vitals in 2020 as measurable, real-world signals of user experience. To build production-grade software, you need to know what they measure, how React affects them, and how to fix them. Let’s walk through the three pillars of Core Web Vitals as they stand today in 2026.
Also Read: React Performance Optimization: 6 Proven Tips for Faster UI
What Are Core Web Vitals in 2026?
Core Web Vitals are three metrics Google uses to judge how a page feels to real users: loading, responsiveness, and visual stability. According to Google’s web.dev documentation, the set is Largest Contentful Paint (LCP), Interaction to Next Paint (INP), and Cumulative Layout Shift (CLS).
Core Web Vitals — Thresholds
The three Google ranking metrics that measure loading speed, interactivity, and visual stability — and what counts as a good score.
| Metric | What it measures | Good | Needs improvement | Poor |
|---|---|---|---|---|
| LCPLargest Contentful Paint | Loading speed | |||
| INPInteraction to Next Paint | Responsiveness | |||
| CLSCumulative Layout Shift | Visual stability |
A page passes Core Web Vitals when at least 75% of real visits reach the “good” level on all three metrics. One slow interaction from a small share of users won’t sink you, but a consistently sluggish page will.
1. Largest Contentful Paint (LCP): Perceived Load Speed
LCP is the loading metric in Core Web Vitals. It measures how quickly the main content of a page renders on screen.
What LCP Measures
The browser looks for the largest image, video poster, or text block visible in the viewport. LCP is the time that one element takes to finish rendering.
The React Problem With LCP
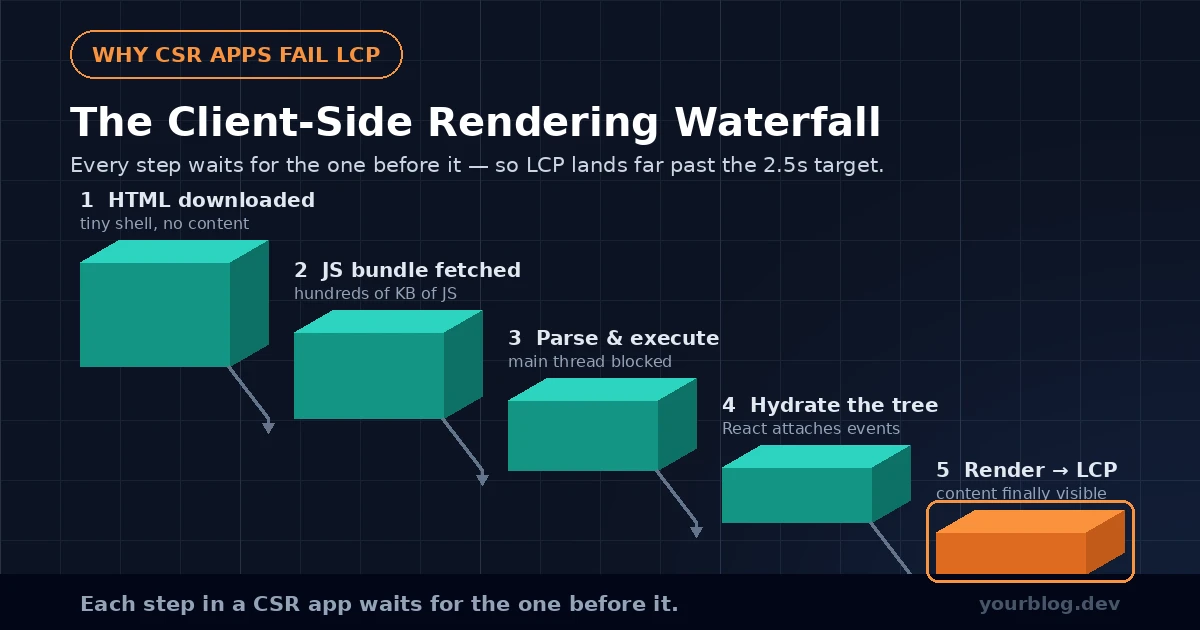
A purely client-side rendered (CSR) React app, like an old create-react-app setup, has a built-in LCP problem. Here’s the waterfall:
- The browser downloads a mostly empty HTML file.
- It downloads a large JavaScript bundle.
- React parses and runs that JavaScript.
- React finally renders the UI and reveals the largest element, maybe a hero image.
- Only then does the browser start downloading that image.
Each step waits for the one before it. That’s why LCP in CSR apps often lands well past 2.5 seconds.
How to Fix LCP
This is exactly why we moved to Next.js with Server-Side Rendering (SSR) and React Server Components (RSCs). The server sends HTML that already contains the largest element. If it’s a text block, LCP happens almost instantly. If it’s an image, the browser finds the <img> tag in the initial HTML and downloads it while the JavaScript loads.
Key optimizations for LCP:
- Use Server Components for above-the-fold content.
- Optimize your hero images and never lazy-load the one that’s likely your LCP element. We’ll cover images in depth in Post 49.
- Keep Time to First Byte (TTFB) low with edge caching or a CDN. Your hosting setup affects TTFB too.
Not sure which element is your LCP? Run the page through Chrome DevTools or PageSpeed Insights. Both name the exact element, so you know what to optimize first.
2. Cumulative Layout Shift (CLS): Visual Stability
CLS is the visual stability metric in Core Web Vitals. It measures how much the page layout shifts unexpectedly during its lifetime.
You’ve probably gone to click a button when an ad loaded at the top and pushed it down. You then clicked a completely different link. That’s a layout shift, and it’s infuriating.
How CLS Is Calculated
CLS multiplies the impact fraction (how much of the viewport changed) by the distance fraction (how far the unstable elements moved). A score of 0.1 or less is good, and anything above 0.25 is poor.
The React Problem With CLS
React developers cause CLS most often with asynchronous data and dynamic content. Here’s a common recipe for bad CLS:
// Bad: nothing reserves space for the profile
function UserProfile() {
  const { data: user } = useQuery({ queryKey: ['user'], queryFn: fetchUser });

  // Initially renders a tiny loading message
  if (!user) return <div>Loading...</div>;

  // When the data arrives, a large block snaps into place
  // and pushes everything else down the page
  return (
    <div>
      <img src={user.avatar} />
      <h1>{user.name}</h1>
      <p>{user.bio}</p>
    </div>
  );
}
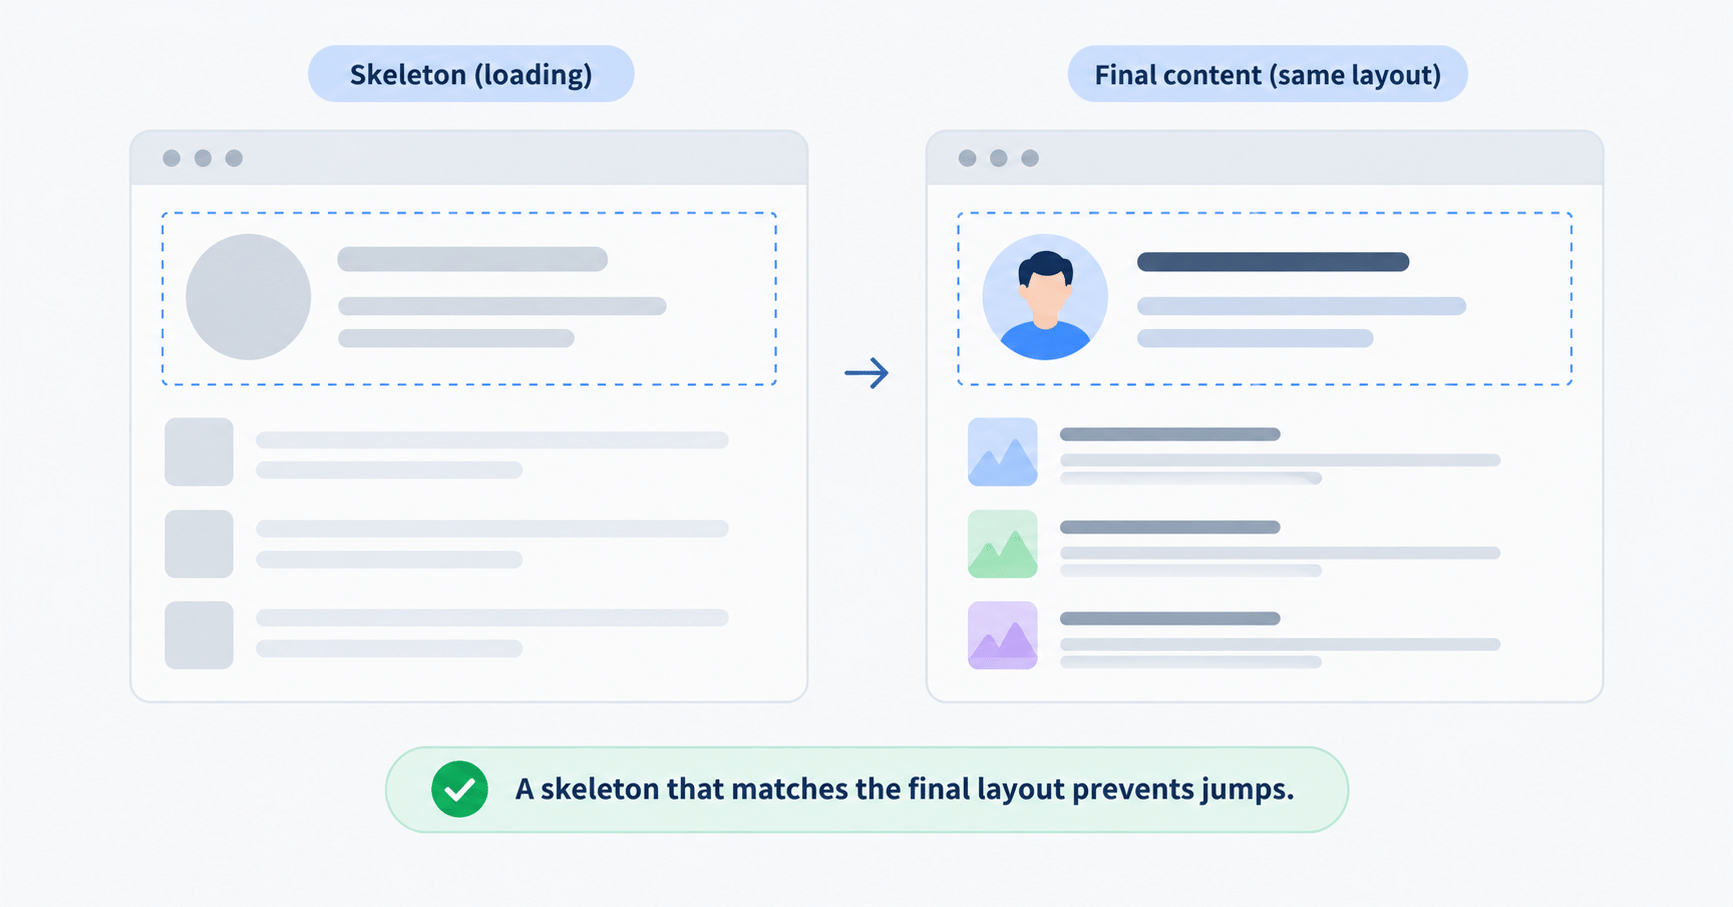
The loading message is one line tall. The finished profile is much taller. Everything below it jumps when the data lands.
How to Fix CLS
The golden rule is simple: always reserve space for content that loads later.
- Use skeleton loaders. Return a placeholder that matches the exact dimensions of the final content instead of a tiny “Loading…” line. If you’re using shadcn ui, it ships a Skeleton component you can reuse.
- Set explicit image dimensions. Add
widthandheightto every<img>tag. The Next.js Image component requires them, so the browser can reserve the space before the file finishes downloading. - Don’t inject content above existing content. If you must show a banner or notification, slide it in with a CSS transform instead of changing the document flow. We covered this kind of CSS and Framer Motion animation in the last post.
Here’s the same component with space reserved:
// Good: the skeleton takes the same space as the final profile
function UserProfile() {
  const { data: user } = useQuery({ queryKey: ['user'], queryFn: fetchUser });

  if (!user) {
    return (
      <div style={{ minHeight: 160 }} aria-busy="true">
        <div style={{ width: 96, height: 96, background: '#e5e7eb' }} />
      </div>
    );
  }

  return (
    <div style={{ minHeight: 160 }}>
      <img src={user.avatar} width={96} height={96} alt={user.name} />
      <h1>{user.name}</h1>
      <p>{user.bio}</p>
    </div>
  );
}
3. Interaction to Next Paint (INP): Responsiveness
INP measures how well a page responds to clicks, taps, and key presses. It replaced First Input Delay (FID) as one of the Core Web Vitals on March 12, 2024, so any advice still built around FID is out of date.
What INP Measures
INP watches the latency of every interaction a user makes and reports one value: the page’s slowest, or nearly slowest, interaction. Google’s INP guide explains that each interaction is timed from the moment the user acts until the browser paints the next frame showing the result. A score of 200 milliseconds or less is good, and anything above 500 milliseconds is poor.
The React Problem With INP
React apps often struggle with INP because rendering happens on the main thread. Say a user clicks a button that triggers a large state update across the app. React has to work out what changed before the browser can paint. During that time, the browser can’t handle other clicks or scroll smoothly, and the page feels frozen.
How to Fix INP
INP is often the hardest of the three Core Web Vitals to improve in a complex React app, because it needs architectural thinking rather than a quick patch.
- Reduce bundle size. Less JavaScript means less parsing and compiling on the main thread. We’ll tackle this in Post 48.
- Avoid large synchronous renders. Break long-running work into smaller pieces.
- Use React 18+ concurrent features. The useTransition hook marks a state update as non-urgent. React can pause that render if something more urgent, like typing, comes in.
Here’s a search box that stays responsive while filtering a large list:
import { useMemo, useState, useTransition } from "react";

function SearchList({ items }) {
  const [isPending, startTransition] = useTransition();
  const [searchQuery, setSearchQuery] = useState("");
  const [filterQuery, setFilterQuery] = useState("");

  // The heavy filtering only re-runs when filterQuery changes
  const results = useMemo(
    () => filterMassiveDataset(items, filterQuery),
[items, filterQuery]
); function handleChange(e) { const value = e.target.value; // 1. The input updates immediately (fast INP) setSearchQuery(value); // 2. The list update is low priority and won’t block typing startTransition(() => { setFilterQuery(value); }); } return ( <> <input value={searchQuery} onChange={handleChange} /> {isPending && <p>Updating results…</p>} <List data={results} /> </> ); }
Notice that startTransition wraps a state update. Wrapping a plain function call does nothing, because React can only defer work that comes from a state change.
How to Measure Your Core Web Vitals
You can’t improve your Core Web Vitals without measuring them first. The tools fall into two groups.
Lab Data vs Field Data for Core Web Vitals
- Lighthouse and PageSpeed Insights give you lab data. It’s synthetic testing that works well during development.
- The Chrome User Experience Report (CrUX) is field data collected from real Chrome users. It’s the data Google’s page experience reporting is built on.
- Vercel Analytics and Sentry are real-user monitoring (RUM) tools. They track your Core Web Vitals in production, so you see how each code change affects real visitors.
Lab scores are a good early warning. Field data tells you whether users actually feel the improvement.

Core Web Vitals FAQ
Do Core Web Vitals affect Google rankings?
Yes, Core Web Vitals are part of Google’s page experience signals. They’re one signal among many, though. Relevant, useful content still matters most, so treat vitals as a way to avoid losing traffic rather than a shortcut to the top.
Why is my Lighthouse score good but Search Console shows poor Core Web Vitals?
Lighthouse runs one simulated test on one device. Search Console reports field data from real visitors on real phones and networks. When the two disagree, trust the field data and use Lighthouse to debug.
Does Next.js give me good Core Web Vitals automatically?
It helps with LCP and CLS through server rendering and the Image component. INP still depends on your own code, since heavy client-side renders and large bundles can slow interactions in any framework.
Can useTransition fix a bad INP on its own?
Not always. It helps when slow renders come from state updates. If the delay comes from a long task outside React, such as a heavy third-party script, you need to split or defer that work instead.
Which of the Core Web Vitals is the fastest to improve?
CLS is often the easiest to improve, because the fixes are mostly markup and CSS. Adding image dimensions and reserving space for async content removes the most common shifts.
Next Steps: Fix Your Core Web Vitals One at a Time
Start by checking your real-user Core Web Vitals data, then fix the worst metric first. LCP usually improves with server rendering, CLS with reserved space, and INP with less JavaScript and smarter state updates.
The biggest enemy of all three is the sheer amount of JavaScript we send to the browser. In Post 48, we’ll tackle Bundle Phobia: analyzing your Webpack or Turbopack bundles, using dynamic imports, and removing dead code.